Vega Lite Reporter
The Vega Lite Reporter reporter is a graph reporter that renders a graph for each suite with each case represented as a bar.
The reporter supports 3 types of outputs:
- HTML - An interactive HTML page that allows filtering of cases and toggling the view mode.
- SVG - A static SVG file with all suites as graphs.
- PNG - A PNG image file with all suites as graphs.
The default configuration is to output all 3 types.
In addition, you can select the view mode:
- horizontal - The graph bar's are laid out horizontally (default)
- vertical - The graph bar's are laid out vertically
info
To render the graph's the reporter use the amazing vega-lite library!
@TouchStone()
class TestRun extends Mixin(VegaLiteReporter) {
getVegaLiteReporterFileOrientation(): Orientation {
return 'horizontal';
}
getVegaLiteReporterFilename(): string {
return 'benchmark-chart';
}
getVegaLiteReporterFileTypes(): Array<'html' | 'svg' | 'png'> {
return ['html', 'png', 'svg'];
}
}
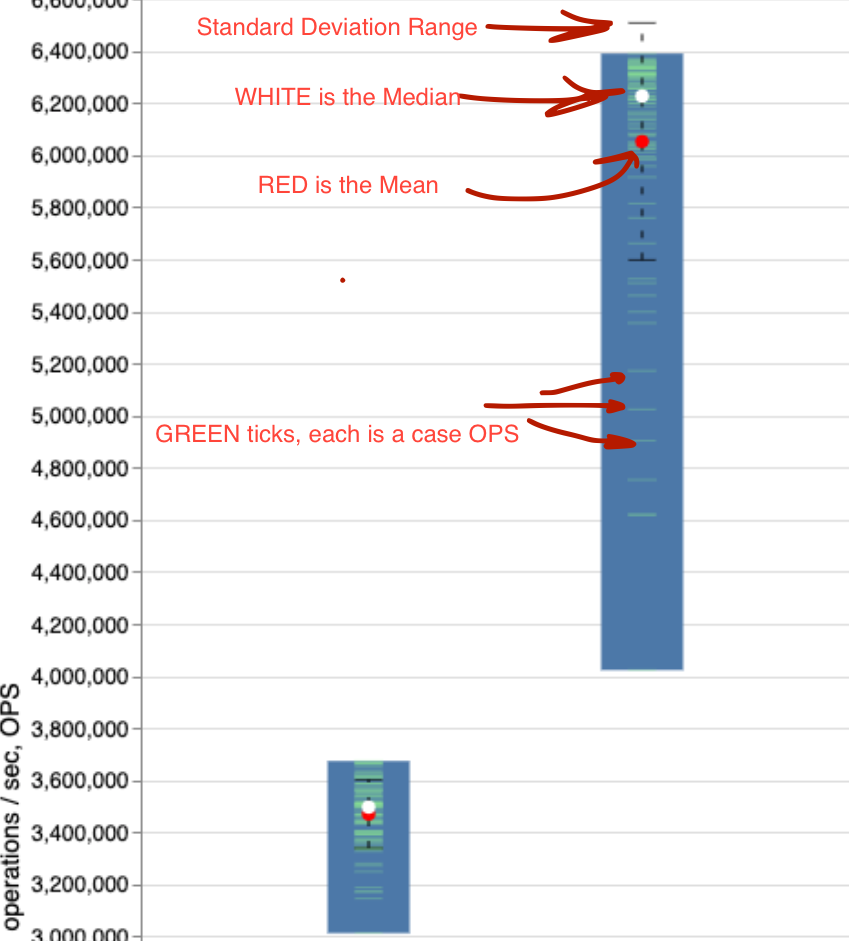
Bar Legend
Each bar in the graph represents the operation per second (OPS) for each case (higher is better).
It is a ranged bar starting from the lowest OPS value measured and ending with the highest OPS value measured.
In between there are multiple indicators:
- A black, dotted, ranged error ruler: representing the range of the standard deviation.
- A white point: representing the median value
- A red point: representing the mean value (average)
- A plot of green lines: each line represents the OPS of a single case.
This will give you the information you need to analyze your benchmarks.